What Harbor Private Equity Actually Is (and How It Differs from Broad Infrastructure Investing)
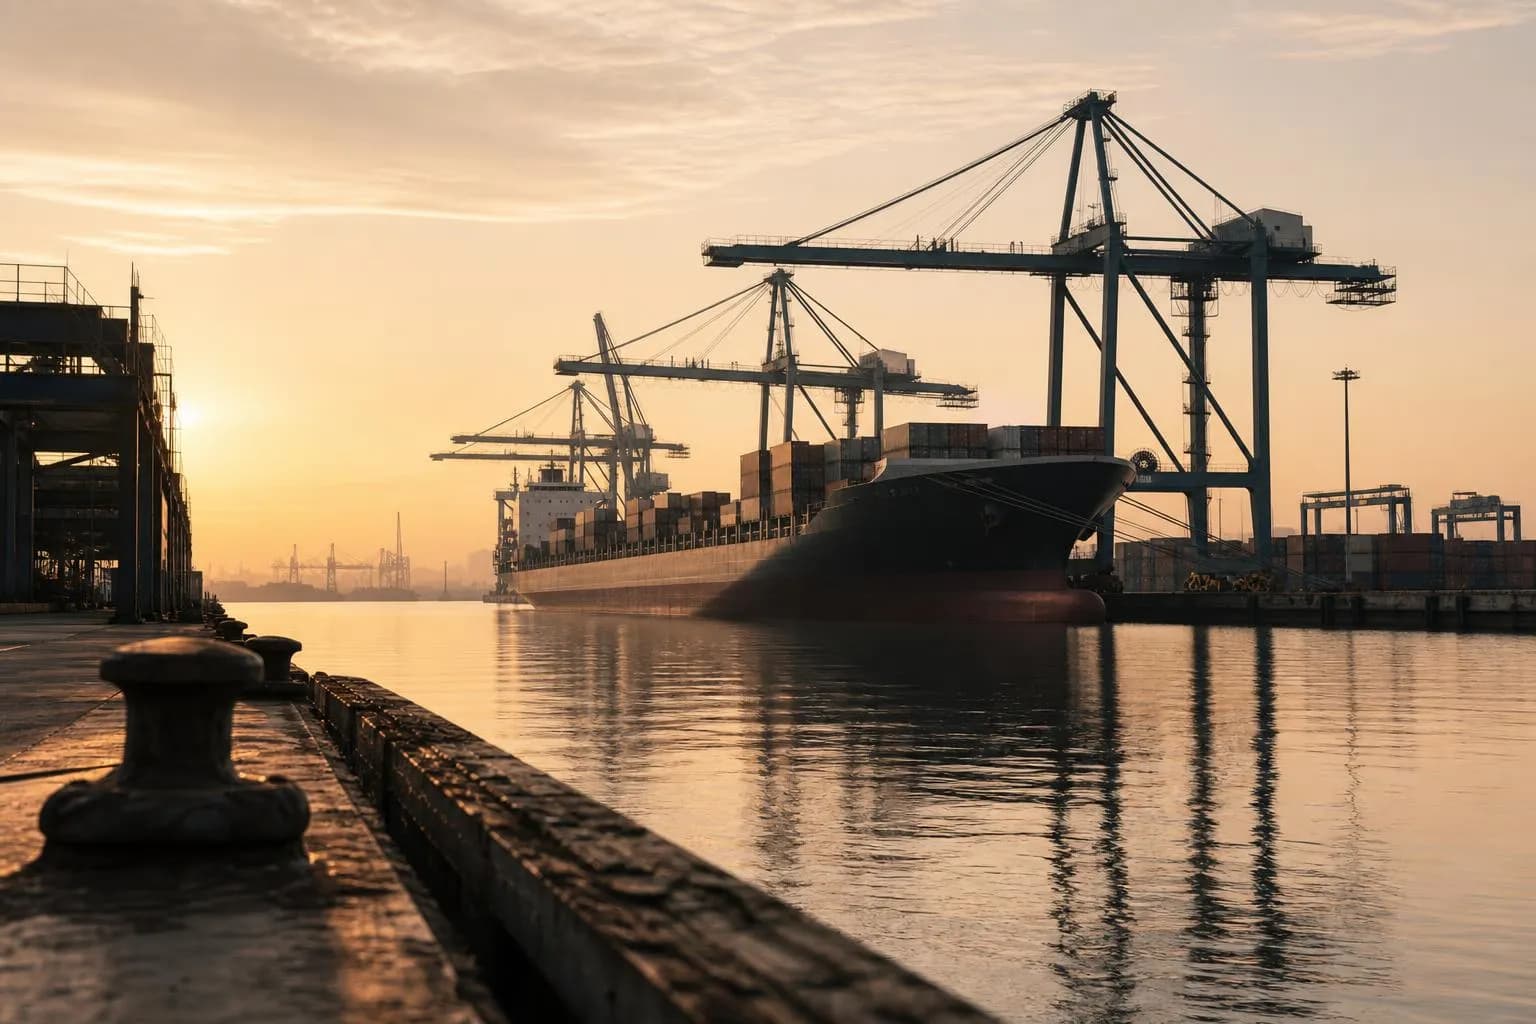
Harbor private equity targets the acquisition, development, and operation of port facilities, marine terminals, and related maritime infrastructure as a distinct asset class within infrastructure private equity. The distinction matters. Broad infrastructure funds treat ports as one line item among roads, utilities, and airports. Dedicated maritime PE funds underwrite port-specific dynamics: vessel size trends, hinterland connectivity, terminal lease structures, and congestion economics that generalist managers routinely miss.
According to UNCTAD's 2023 Review of Maritime Transport, seaborne trade accounts for approximately 80% of global merchandise trade by volume. That single figure explains why ports sit at the intersection of essential infrastructure and durable cash flow. The assets are irreplaceable, the switching costs for shipping lines are high, and the pricing power for well-positioned terminals is real.
The structural difference from, say, a toll road or a regulated utility is that port revenues are more directly tied to trade volumes and shipping industry consolidation. That creates both upside and cyclicality that pure infrastructure investors sometimes underestimate. Understanding maritime investment banking fundamentals is a prerequisite before committing capital here, because the deal structures and counterparty dynamics are genuinely specialized.
What Returns Can Investors Expect from Port Infrastructure Private Equity Funds?
The return profile for harbor private equity sits above traditional infrastructure but below pure buyout PE, which is roughly where you want it for a long-duration, cash-yielding allocation.
According to Preqin's 2023 Global Infrastructure Report, transportation-focused infrastructure PE funds, including ports and terminals, posted median net IRRs of approximately 9 to 13% over vintage years 2010 to 2020. Top-quartile funds exceeded 15% net IRR. The OECD has documented that infrastructure assets including ports have historically delivered long-term, inflation-linked returns in the 8 to 12% IRR range for institutional investors, making them competitive alternatives to investment-grade fixed income with meaningfully better inflation protection.
The congestion dynamic is worth understanding because it runs counter to conventional risk framing. During the 2021 to 2022 supply chain crisis, major port operators reported record EBITDA margins. Port congestion, widely viewed as an operational failure, actually drove surcharge revenue, extended dwell fees, and premium berth pricing. The asset class is partially counter-cyclical to supply chain disruption in a way that benefits the infrastructure owner even as it punishes shippers and cargo owners.
Typical deal structures target entry valuations in the range of 12 to 18x EBITDA for core ports in developed markets, with value-add plays in emerging markets pricing at lower multiples to compensate for political and currency risk. Hold periods run 7 to 12 years. Exit mechanisms include strategic sales to sovereign wealth funds or pension funds, secondary PE sales, and occasionally public listings of port operating companies.
| Return Metric | Core Port Assets | Value-Add / Emerging Market | Top-Quartile Funds |
|---|---|---|---|
| Target Net IRR | 8–11% | 12–18% | 15%+ |
| Typical MOIC | 1.6–2.0x | 2.0–3.0x | 2.5x+ |
| Hold Period | 10–15 years | 7–10 years | Varies |
| Entry Multiple (EV/EBITDA) | 14–18x | 10–14x | Deal-dependent |
| Preferred Return Hurdle | 8% | 8% | 8% |
These are ranges drawn from fund reporting and industry data, not guarantees. Vintage year matters considerably, and the 2008 to 2009 shipping collapse demonstrated that even essential infrastructure can see throughput fall 15 to 20% in a severe global recession.
How Accredited Investors Access Maritime Private Equity Funds
This is where the path diverges sharply depending on your capital base and legal classification.
The SEC's Rule 501 of Regulation D defines accredited investor status at $1 million net worth (excluding primary residence) or $200,000 in annual income. That threshold gets you into the waiting room. The funds worth being in typically require qualified purchaser status under the Investment Company Act, which means $5 million in investments. That is the bar that unlocks access to the most sophisticated maritime PE vehicles.
Minimum LP commitments for institutional-quality harbor PE funds run $5 to $25 million for direct positions. Some managers offer feeder fund structures that lower the entry point to $250,000 to $1 million for qualified purchasers, though you absorb an additional fee layer. The standard fee structure is 1.5 to 2% management fee on committed capital with 20% carried interest above an 8% preferred return hurdle.
For FATFIRE-level investors who want direct exposure without committing to a 10-year lockup, direct investment approaches in infrastructure through co-investment rights alongside a lead GP are worth negotiating at the time of fund commitment. Co-investments typically carry no additional management fee or carry, which meaningfully improves net returns on that capital.
Sidecar investment structures are another access mechanism, particularly for investors who want deal-by-deal exposure to specific ports rather than blind pool risk across a diversified fund. The tradeoff is concentration and the need for your own operational due diligence capability.
| Investor Type | Minimum Commitment | Fee Structure | Access Vehicle |
|---|---|---|---|
| Qualified Purchaser ($5M+ investments) | $250K–$1M (feeder) | 1.5–2% mgmt / 20% carry | Feeder fund LP |
| Institutional LP (direct) | $5M–$25M | 1.5–2% mgmt / 20% carry | Direct LP |
| Co-investor (alongside GP) | Deal-specific | 0% mgmt / 0–10% carry | Co-investment |
| Sidecar investor | Deal-specific | Negotiated | Sidecar vehicle |
Which Private Equity Firms Specialize in Port and Maritime Infrastructure?
The field is smaller and more specialized than generalist infrastructure PE. A handful of managers have built genuine maritime operating expertise rather than simply applying a standard infrastructure underwriting template to port assets.
HarbourVest Global Private Equity is frequently cited in this context, though its primary focus is fund-of-funds and secondary strategies across PE broadly, not dedicated maritime infrastructure. Investors should be precise about what they are actually buying.
The firms with genuine port operating DNA include Macquarie Infrastructure and Real Assets (MIRA), which has held significant port positions across Asia-Pacific and Europe; Global Infrastructure Partners (now part of BlackRock), which has invested in major terminal operators; and DP World, which operates as both an infrastructure owner and a strategic acquirer. Brookfield Asset Management's infrastructure fund has also taken positions in port and logistics assets.
S&P Global Market Intelligence data shows that the top 10 global port operators, including Hutchison Ports, PSA International, and DP World, collectively handle a dominant share of global container throughput. This oligopolistic structure creates barriers to entry and pricing power that PE investors in these assets benefit from directly.
For investors evaluating current private equity market trends, the consolidation among port operators is accelerating, which is compressing the universe of available acquisition targets while simultaneously increasing the value of existing positions.
| Firm | Geographic Focus | Strategy | Notable Port Assets |
|---|---|---|---|
| Macquarie MIRA | Global, Asia-Pacific | Core infrastructure | Multiple terminal positions |
| BlackRock / GIP | Global | Core-plus | Terminal operator stakes |
| Brookfield Infrastructure | Americas, Europe | Value-add | Port and logistics assets |
| Stonepeak | North America | Core-plus | U.S. terminal infrastructure |
| I Squared Capital | Emerging markets | Value-add | Asia, LatAm port positions |
Tax Implications of Investing in Port Infrastructure Through a U.S. LP Structure
This section deserves more attention than it typically gets in maritime PE discussions, because the tax treatment is genuinely complex and the upside is real for investors with diversified passive income.
Port equipment and terminal improvements can qualify for bonus depreciation under IRC Section 168(k). Under the Tax Cuts and Jobs Act schedule, bonus depreciation was 100% through 2022, dropped to 80% in 2023, 60% in 2024, and 40% in 2025 under current law. Investments structured through an operating partnership can generate passive losses from accelerated depreciation that offset other passive income, which is meaningful for FATFIRE investors running rental portfolios, royalty streams, or other passive income sources.
The K-1 complexity from maritime LP structures is real and should not be underestimated. Multi-jurisdictional port operations generate state and foreign tax filings that your CPA needs to be equipped to handle. Budget for this.
For foreign port investments, the IRS's FIRPTA provisions create additional complexity. As the IRS notes in Publication 515, U.S. investors in foreign port infrastructure through certain fund structures may face FIRPTA-related withholding obligations and complex tax treaty considerations. The fund's legal structure, specifically whether it holds foreign port assets through a U.S. blocker corporation, a foreign partnership, or directly, determines your exposure. Get this answered before you commit capital, not after.
Preferred equity structures in maritime PE can also affect your tax treatment, particularly around the timing of income recognition versus capital gain characterization of carried interest and exit proceeds.
REIT structures are occasionally used for port-adjacent real estate, but pure port operations rarely qualify for REIT treatment given the active business character of terminal operations. The entity structuring decision belongs in a conversation with a tax attorney who specializes in infrastructure PE, not a generalist.
How Geopolitical Risk Affects Port Infrastructure Investments in Emerging Markets
Geopolitical risk in maritime PE is not abstract. It shows up in specific, quantifiable ways that affect underwriting assumptions.
The most direct exposure is trade route disruption. A port whose primary traffic depends on bilateral trade between two countries in a deteriorating diplomatic relationship carries concentrated geopolitical risk. The 2018 to 2019 U.S.-China trade tensions shifted container routing patterns measurably, benefiting some Southeast Asian transshipment hubs while reducing throughput at ports more dependent on direct U.S.-China flows.
Asian maritime investment hubs carry their own specific risk profiles. Hong Kong's port position has shifted as regional trade patterns have evolved and as Singapore's maritime investment landscape has strengthened its position as the dominant transshipment hub in Southeast Asia. Singapore handled over 37 million TEUs in 2022, a figure that reflects both its geographic position and its political stability premium.
Currency risk is the second major variable. Emerging market port investments generate local currency revenues against dollar-denominated fund structures. A port in Brazil generating reais-denominated EBITDA that looks attractive at current exchange rates can deliver materially lower dollar returns if the real depreciates. Sophisticated funds hedge this exposure at the fund level, but the cost of hedging reduces net returns and should be modeled explicitly.
Political risk insurance through MIGA (the World Bank's Multilateral Investment Guarantee Agency) or private insurers is available for emerging market port positions and is worth pricing into the underwriting. The premium is real, but so is the downside it protects against.
| Region | Key Risk Factors | Mitigation Tools | Return Premium vs. Developed Market |
|---|---|---|---|
| Southeast Asia | Currency, regulatory change | Political risk insurance, USD offtake agreements | 3–5% IRR premium |
| Sub-Saharan Africa | Political stability, FX, infrastructure | MIGA coverage, local partner structures | 5–8% IRR premium |
| Latin America | FX volatility, regulatory risk | Hedging, concession structure | 3–6% IRR premium |
| Middle East | Geopolitical concentration | Sovereign partner, concession terms | 2–4% IRR premium |
Port Infrastructure Asset Types: Risk-Return Profiles for Different Investor Mandates
Not all port assets carry the same risk-return profile, and the original article's list of asset types without context is not useful for investment decision-making.
Container terminals are the core institutional asset. They generate predictable throughput-based revenues, benefit from long-term shipping line contracts, and are the primary target for large infrastructure funds. Entry multiples are highest here, but so is liquidity at exit.
Bulk cargo facilities, covering dry bulk (grain, coal, iron ore) and liquid bulk (petroleum, chemicals), carry commodity price correlation that container terminals do not. A coal terminal in a jurisdiction moving toward energy transition faces secular demand risk that must be modeled over a 15-year hold period. Liquid bulk terminals serving petroleum products face similar long-term questions, though the timeline is longer.
Cruise terminals are the most cyclical of the major asset types. The COVID-19 pandemic demonstrated that cruise terminal revenues can go to near-zero in a demand shock. They also tend to be more dependent on municipal concession agreements with shorter terms.
Intermodal transport hubs and inland container depots are increasingly attractive because they capture value from the full logistics chain rather than just the waterfront. Platform investment strategies that combine a port terminal with inland logistics assets create more defensible competitive positions and higher EBITDA margins.
Maritime technology companies represent the venture-adjacent end of the spectrum. IoT-enabled terminal management systems, AI-powered vessel scheduling, and blockchain-based documentation platforms are real businesses with real revenue, but they carry technology risk and competitive dynamics that are fundamentally different from infrastructure assets. Mixing them into an infrastructure fund creates valuation and risk profile complexity.
Climate Risk as an Underwriting Variable, Not an ESG Abstraction
For investors evaluating 15 to 25-year infrastructure hold periods, climate physical risk is a present-value underwriting variable, not a distant policy concern.
Moody's and S&P have both developed climate risk overlays for infrastructure credit ratings. Ports in low-elevation coastal zones face measurable long-term capital expenditure requirements for flood mitigation, storm surge protection, and sea-level adaptation. The Port of Rotterdam has committed billions in climate adaptation infrastructure, a cost that PE investors in similar assets must model into their underwriting assumptions.
The practical implication for due diligence is straightforward: any port acquisition should include a third-party climate physical risk assessment that models sea-level rise scenarios against the asset's elevation, drainage infrastructure, and critical equipment placement. This is now standard practice among institutional infrastructure managers and should be a red flag if a GP cannot produce it.
Stranded asset risk is the second dimension. A coal export terminal that looks attractive on current throughput projections may face secular volume decline as energy transition accelerates. The underwriting needs to stress-test against a scenario where coal export volumes decline 30 to 50% over the hold period, because that scenario is plausible in multiple geographies.
Permanent capital strategies in infrastructure, which avoid the forced exit pressure of a 10-year fund structure, are better suited to assets with long adaptation timelines. If you are investing in a port that will require $200 million in climate adaptation capex over 20 years, a fund with a fixed 10-year life creates misaligned incentives around that capital expenditure.
Due Diligence Framework for Harbor Private Equity Investments
The due diligence process for a port acquisition is materially different from a standard PE buyout. The operational complexity requires domain expertise that most generalist PE teams do not have in-house.
Start with throughput analysis. Container throughput measured in TEUs (twenty-foot equivalent units), berth productivity measured in moves per hour, and vessel turnaround time are the core operational metrics. World Bank container port traffic data provides benchmarks for comparable facilities. A port operating at 60% of benchmark productivity has upside, but you need to understand whether the gap is equipment, labor, management, or structural (water depth, berth configuration) before you can underwrite the improvement.
Hinterland connectivity is the second critical variable. A port's catchment area, its rail and road connections to major population and industrial centers, and its competitive position relative to nearby ports determine whether throughput growth is achievable or whether you are buying a structurally disadvantaged asset at a price that assumes improvement.
Concession structure and term are non-negotiable due diligence items. Most ports operate under concession agreements with port authorities or government entities. The term remaining, renewal rights, revenue sharing provisions, and capital expenditure obligations embedded in the concession determine the actual economics of the investment. A port with 8 years remaining on a non-renewable concession is a fundamentally different investment than one with 30 years and renewal options.
McKinsey estimated a global infrastructure investment gap of approximately $350 billion per year through 2030, with ports and maritime logistics representing a significant portion of unmet capital needs. That gap creates opportunity, but it also means many assets require substantial capital expenditure before they generate target returns. Model the capex requirements conservatively.
Portfolio company structures in maritime PE deals often involve complex layering of operating companies, holding companies, and concession entities across multiple jurisdictions. Understanding the legal and tax structure of what you are actually acquiring requires specialized maritime legal counsel, not just a standard M&A team.
Is Port Infrastructure Private Equity a Genuine Inflation Hedge for High-Net-Worth Investors?
The inflation protection case for port infrastructure is real but requires precision about the mechanism.
Port revenues are typically linked to trade volumes rather than directly indexed to inflation. The inflation protection comes from two sources: pricing power and asset replacement value. Well-positioned ports with limited competition can pass through cost increases in the form of higher tariffs and surcharges. The asset replacement value of port infrastructure, cranes, berths, dredged channels, and terminal buildings, rises with construction cost inflation, which supports valuations even when throughput is flat.
The OECD's research on infrastructure assets confirms the inflation-linkage property, noting that ports have historically delivered returns in the 8 to 12% IRR range with meaningful inflation correlation. That compares favorably to investment-grade bonds in a rising inflation environment, which is the relevant comparison for the fixed-income allocation it typically displaces in a FATFIRE portfolio.
The caveat is that trade volume sensitivity creates a correlation with global economic conditions that pure inflation-linked assets like TIPS do not have. In a stagflationary environment, where inflation is high but trade volumes are falling, port revenues can underperform. The 2008 to 2009 period, when global container throughput fell sharply, is the relevant stress case.
For a $5M+ net worth investor with a diversified portfolio, a 5 to 10% allocation to harbor private equity through a qualified infrastructure fund provides meaningful inflation protection and portfolio diversification without excessive concentration in a single asset type. The low correlation to public equities and investment-grade bonds is well-documented, and the cash yield from operating port assets provides income that pure growth PE does not.
References
- OECD -- "Pension Fund Investment in Infrastructure: A Comparison Between Australia and Canada" (2014)
- World Bank -- "Container Port Traffic (TEU: 20-foot equivalent units) -- World Development Indicators" (2023)
- McKinsey Global Institute -- "Bridging Global Infrastructure Gaps" (2016)
- Internal Revenue Service -- "Publication 515: Withholding of Tax on Nonresident Aliens and Foreign Entities (FIRPTA provisions)" (2024)
- Preqin -- "Global Infrastructure Report" (2023)
- UNCTAD -- "Review of Maritime Transport" (2023)
- U.S. Securities and Exchange Commission -- "Accredited Investor Definition -- Rule 501 of Regulation D" (2020)
- S&P Global Market Intelligence -- "Global Port and Terminal Operator Rankings" (2023)